DECODE-RAPL
Predicting CPU Power from OS-Level Metrics
DElayed Embedding COnvolutional network for DEcoding RAPL
A Deep Learning Journey Through Multiple Architectures
Problem & Challenge
- RAPL (Running Average Power Limit) — Intel's hardware power meter — is unavailable in VMs
- Goal: Predict CPU package power (Watts) using only VM-visible OS metrics from
/proc - Same CPU% ≠ Same Power: 50% CPU on AVX-512 matrix multiply (~45W) vs. scalar sorting (~30W)
- OS metrics miss microarchitectural details: instruction mix, cache behavior, pipeline utilization
- Power has temporal dynamics: thermal inertia, frequency scaling, ramp-up/cool-down
Core question: Can we reconstruct enough hidden CPU state from OS-level observables to predict power accurately?
MS-TCN: Multi-Scale Temporal CNN
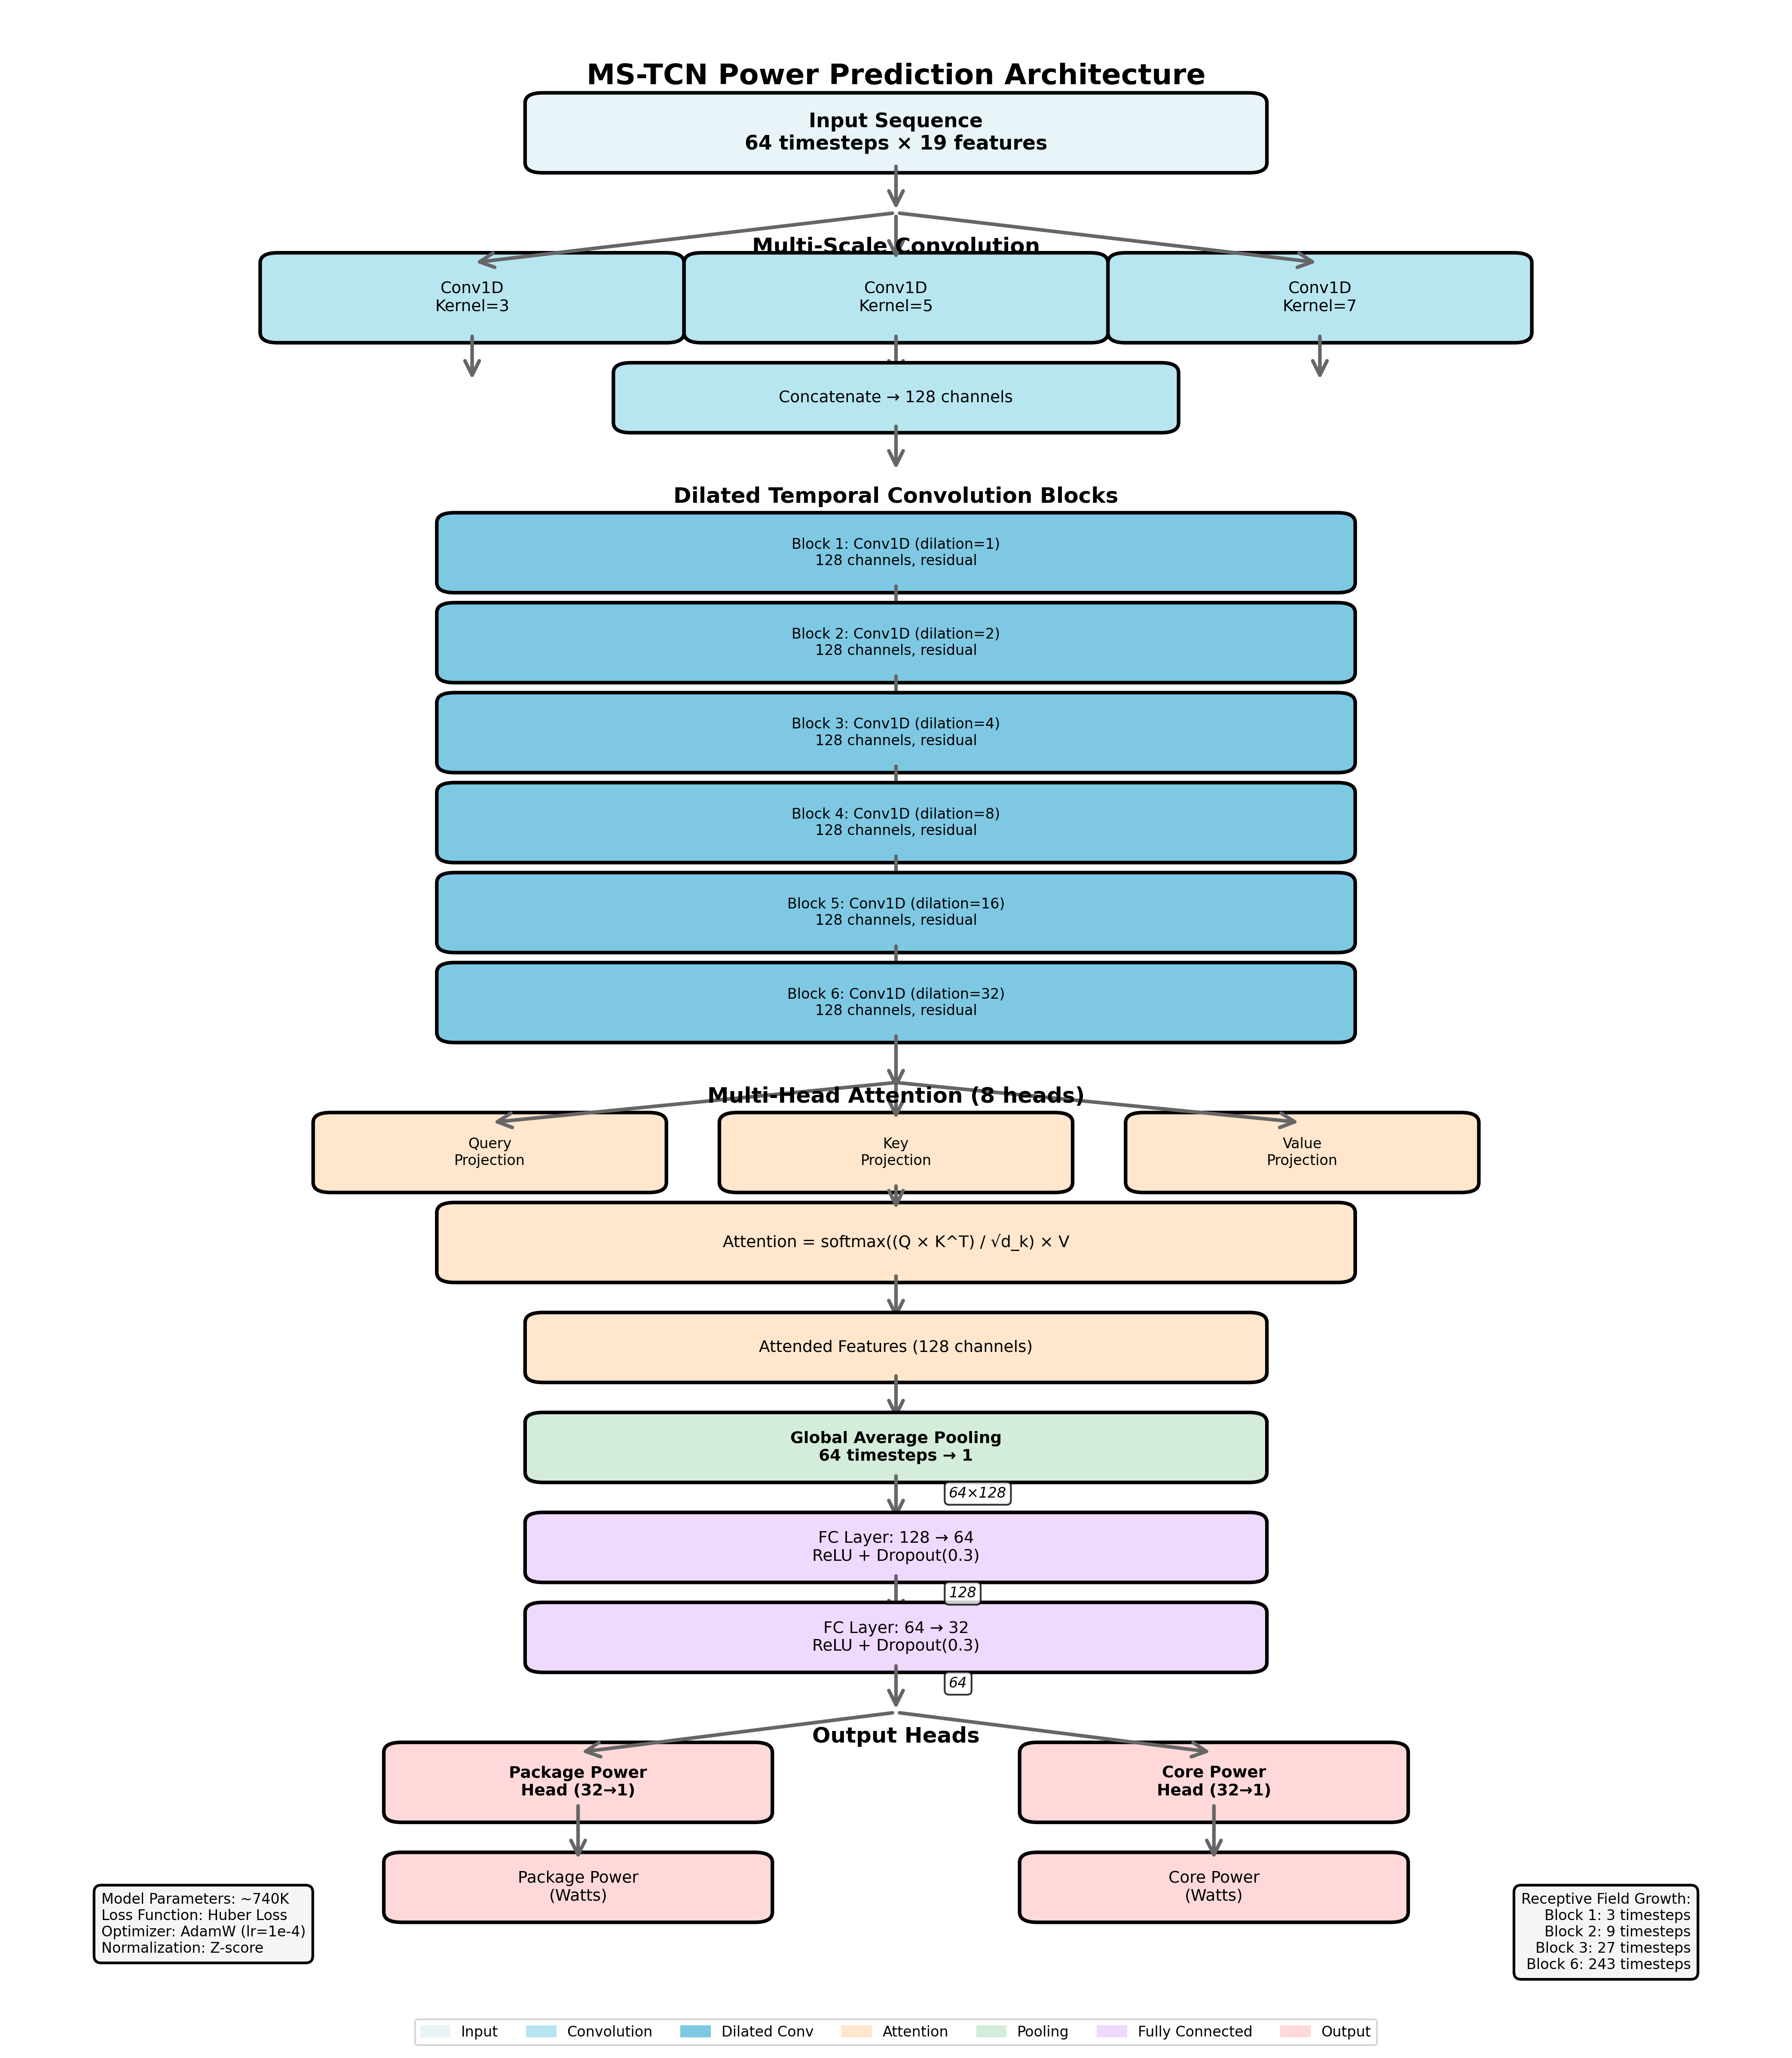
- 19 system metrics at 62.5 Hz, 740K params
- Multi-scale convolutions (kernel 3/5/7)
- 6 dilated temporal blocks (dilation 1→32)
- Multi-head attention (8 heads)
- Validation: R² = 0.96, MAE = 3.50W
- Real workloads: Failed — data 98% skewed to <30W
Lesson: The problem isn't model complexity — it's the information content of the features.
v1: Delay Embedding + AE + LSTM
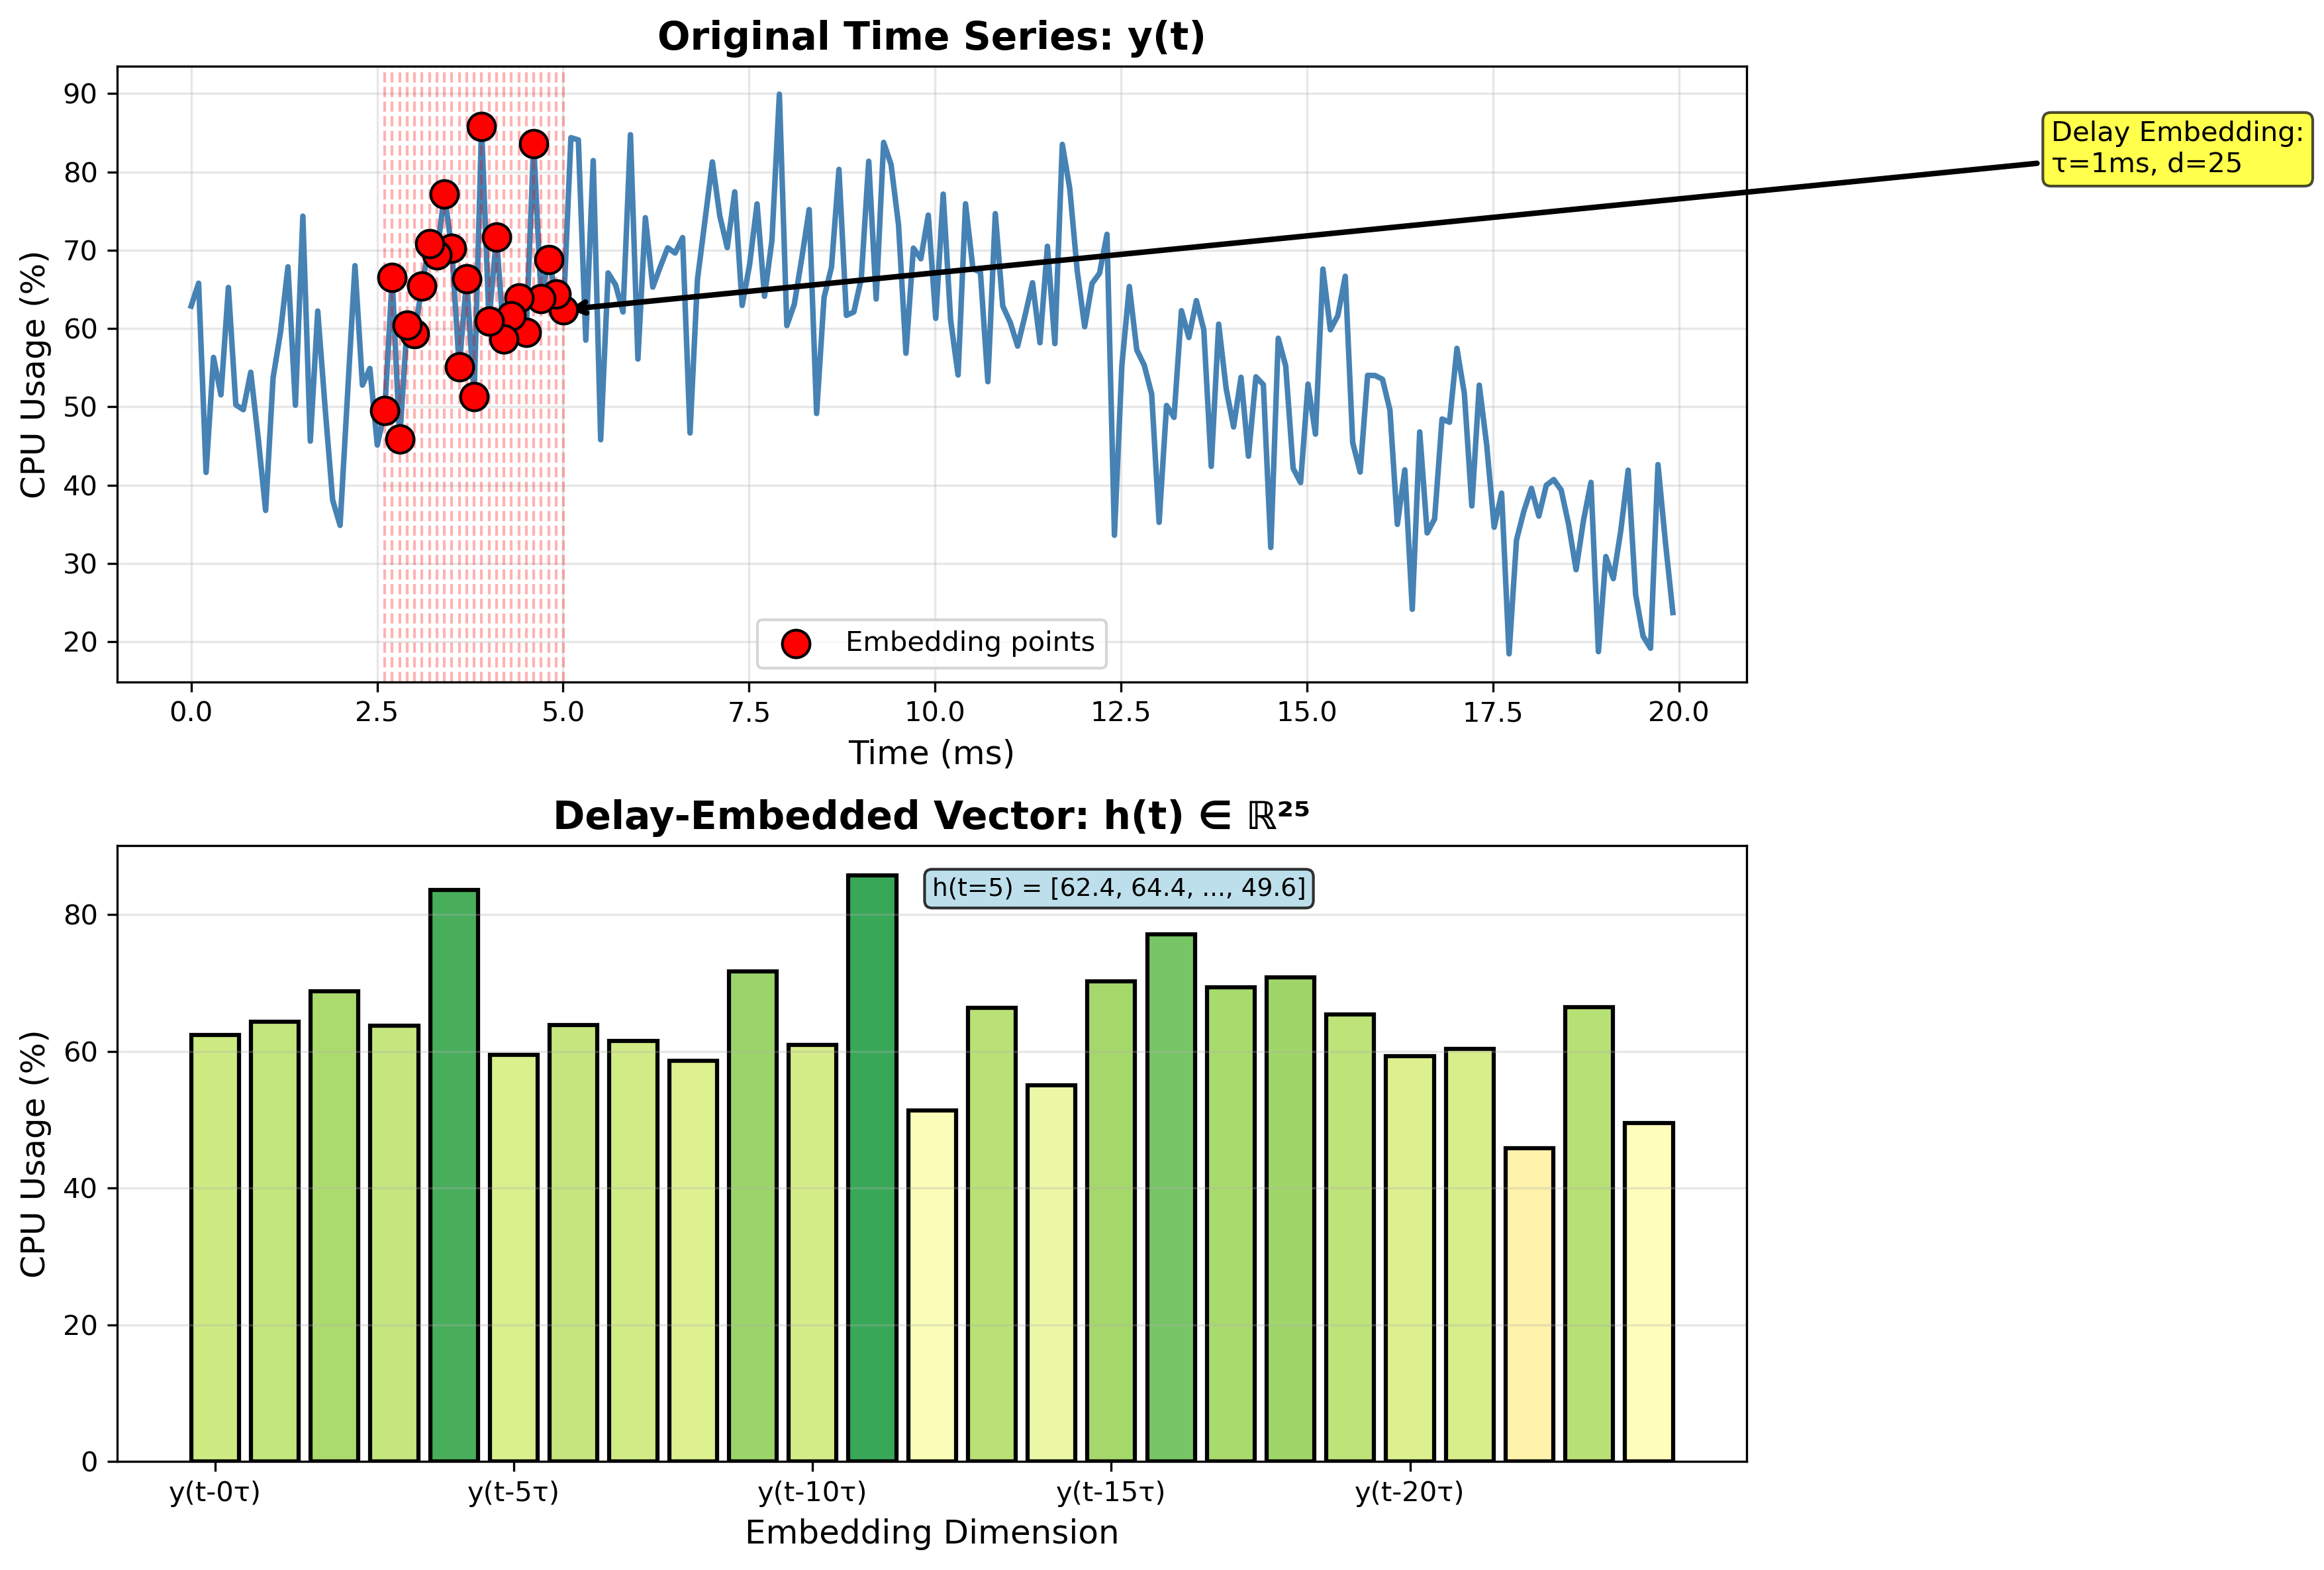
Key Idea: Takens' Theorem
- Treat CPU power as a dynamical system with hidden state
- Time-delayed copies reconstruct full state space
h(t) = [y(t), y(t-τ), ..., y(t-24τ)]- 4 features × 25 delays = 100-D input
- Features:
user%,system%,iowait%,log(ctx/sec)
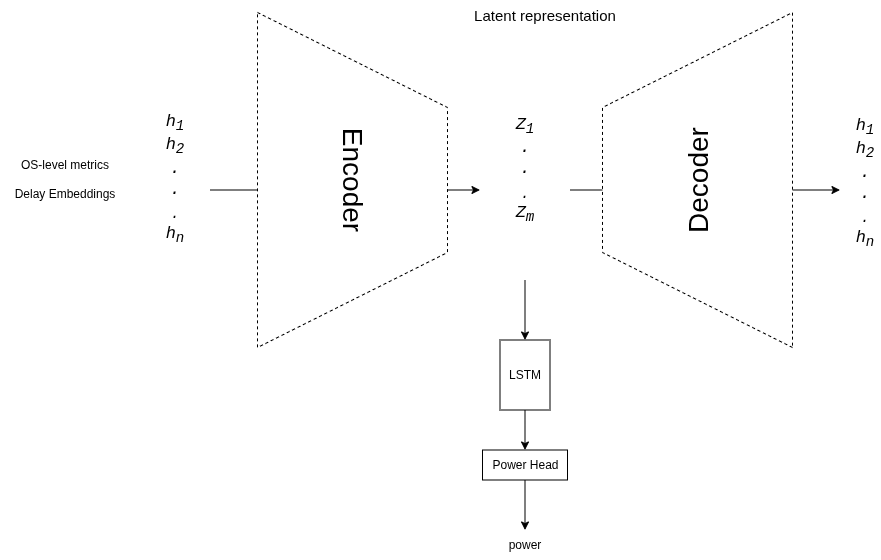
Loss = α · Lpower + β · Lreconstruction
v1: Results — Great Offline, Bad Live
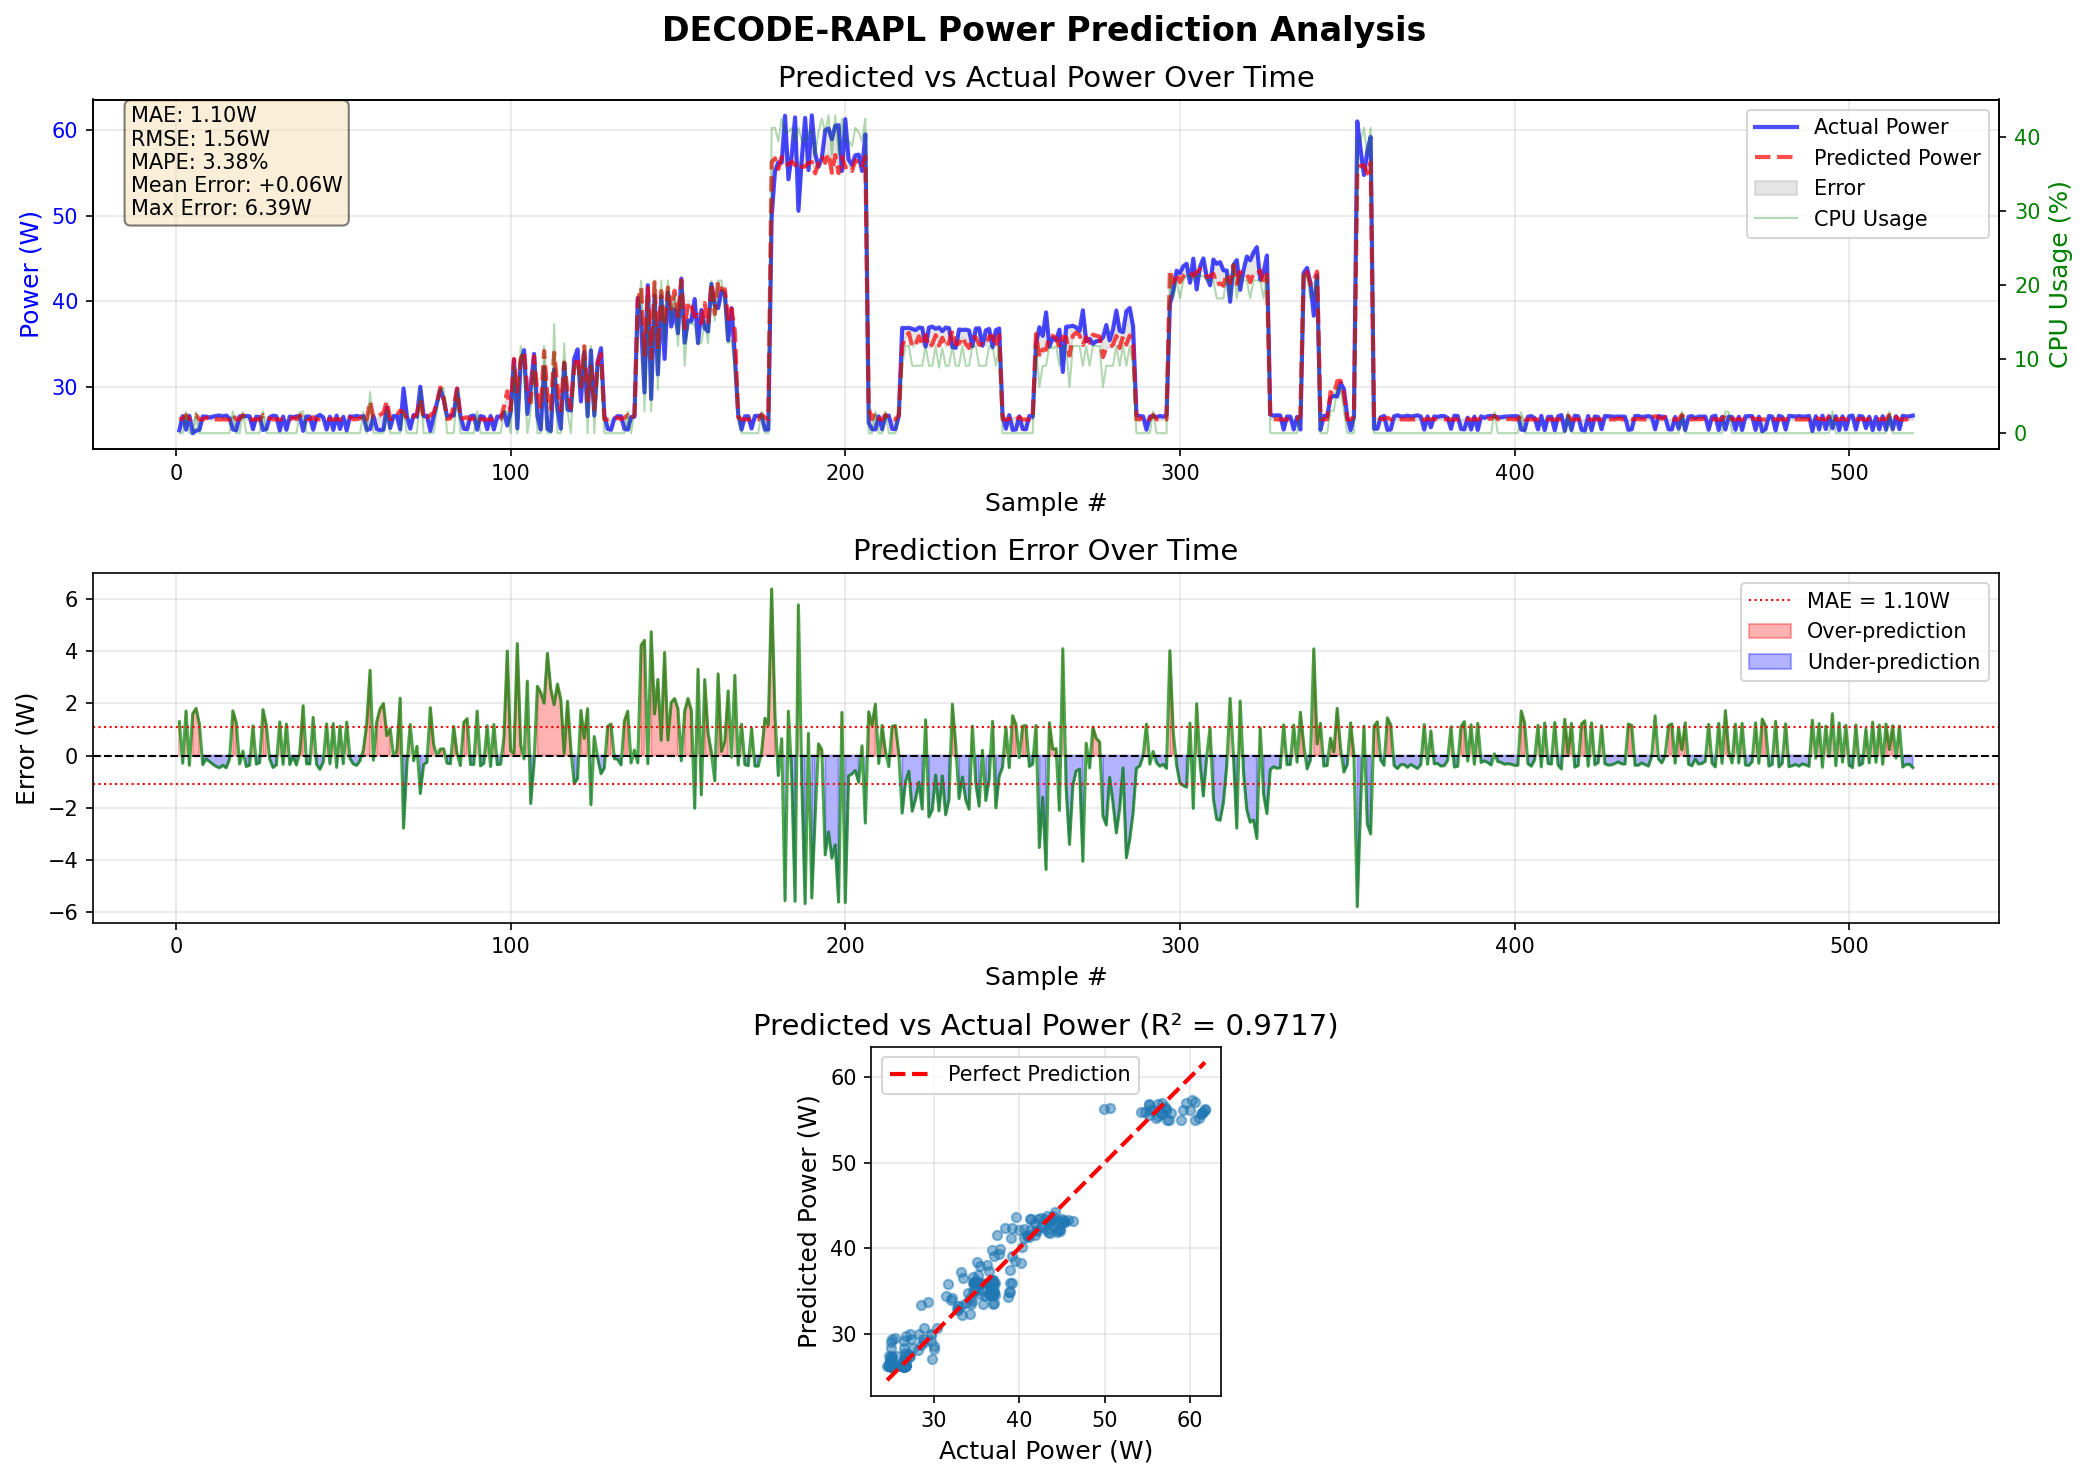
stress-ng test: R² = 0.97
Real workloads: R² = 0.29–0.40, +10W bias
Diagnosis: Model memorized stress-ng patterns. Training data lacked diversity. LSTM may be redundant given delay embedding already encodes temporal info.
Better Data: The "Gold Mine" Dataset
- Combinatorial workload generator: 6 stressors × multiple levels = 2,025 unique combos
- Go-based collector: 16ms interval, minimal overhead
- 5.8M samples, power range 24W–102W
- Includes true idle + real /proc reader workloads
- Multi-tau delay embedding (τ = 1, 4, 8)
- MinMaxScaler on train split; global shuffle

Pure idle (all stressors = 0)
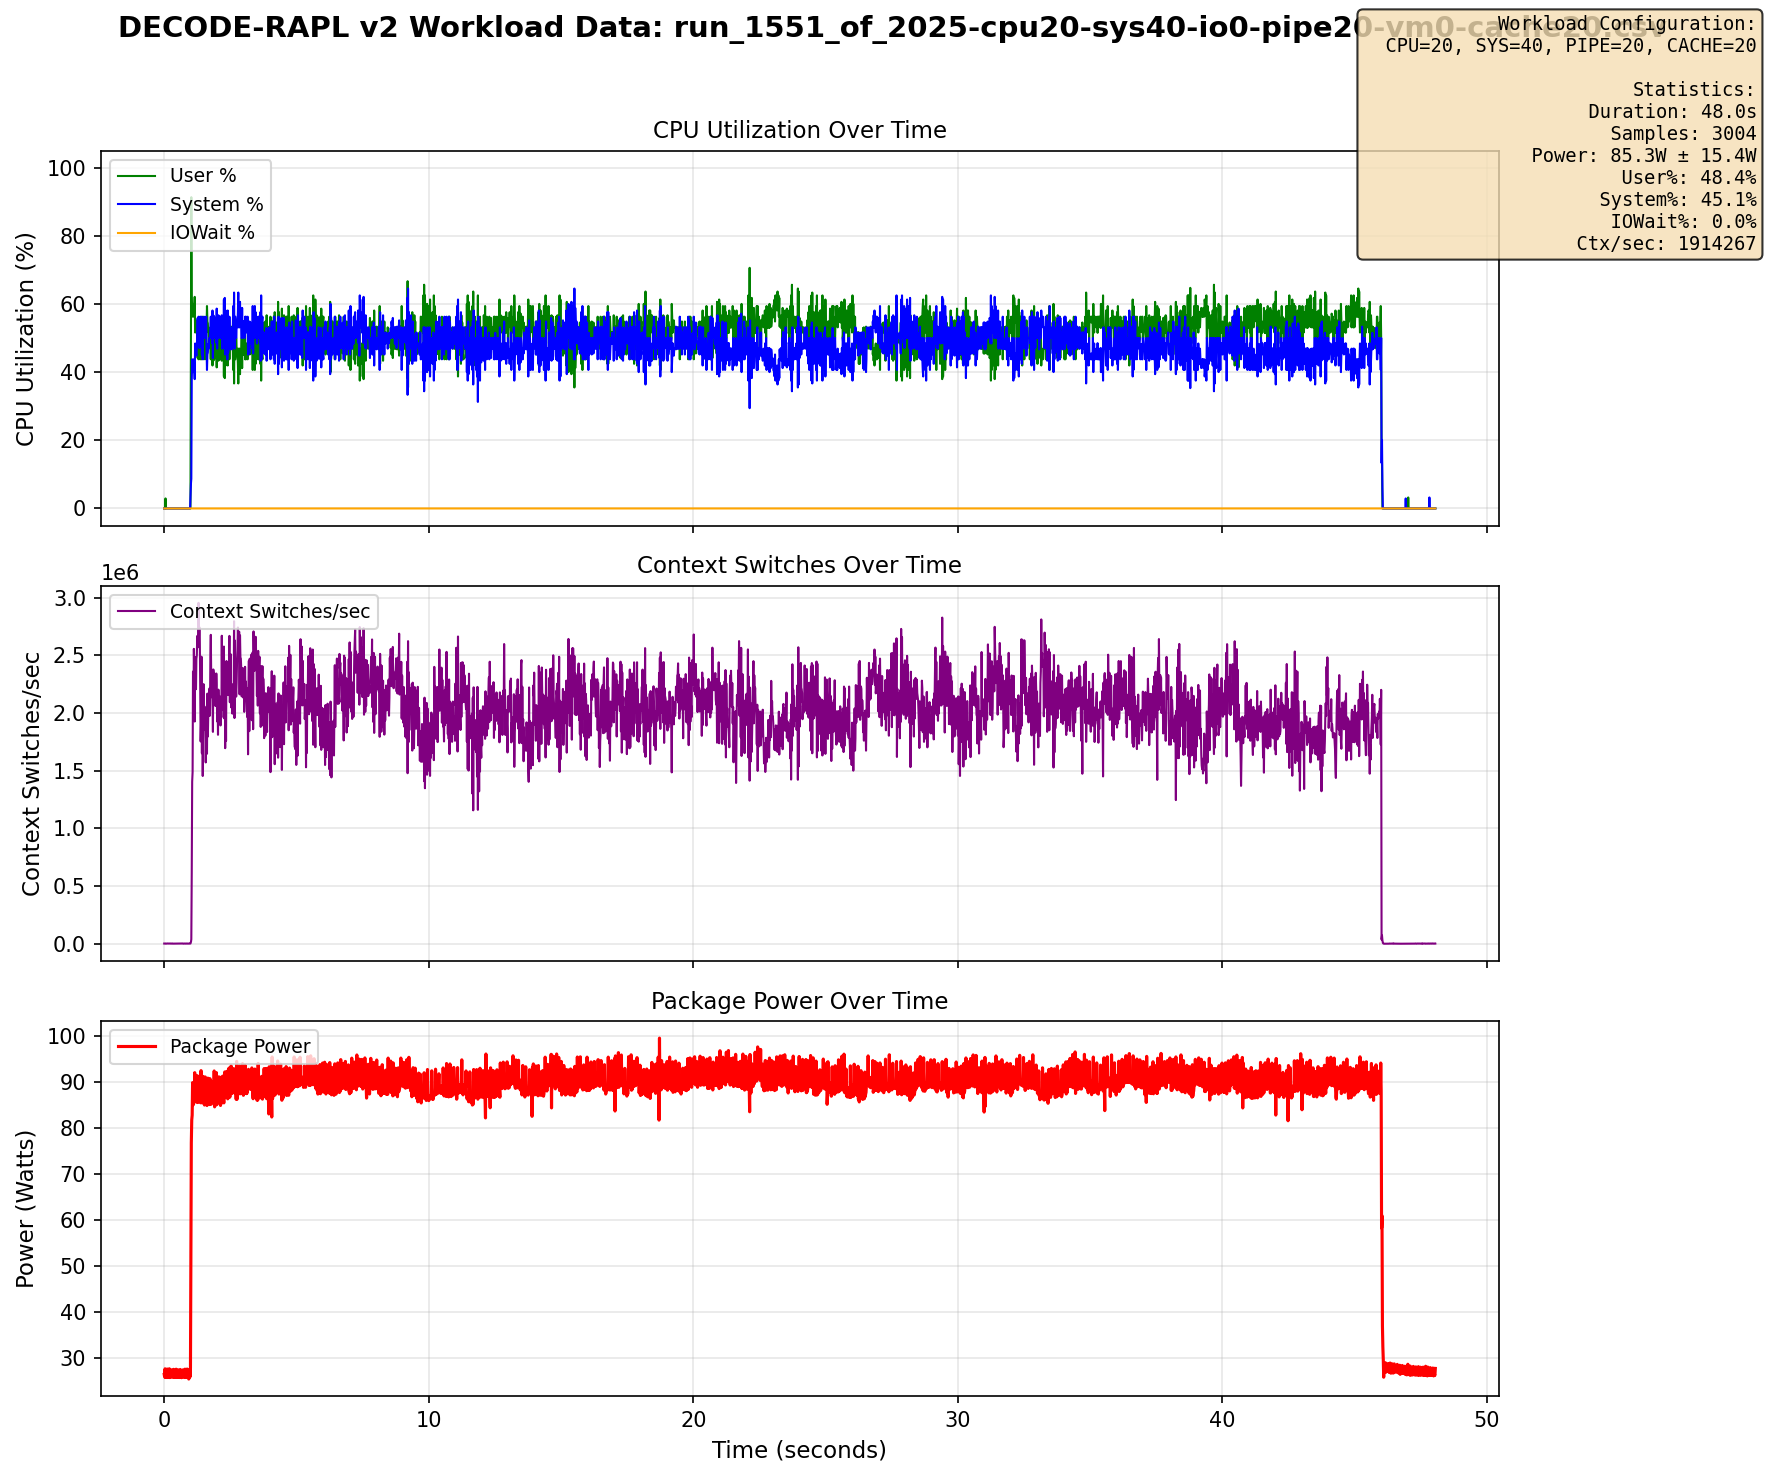
Mixed: cpu=20, sys=40, pipe=20, cache=20
v2 & v3: Simplifying the Architecture
v2: AE + Power Head
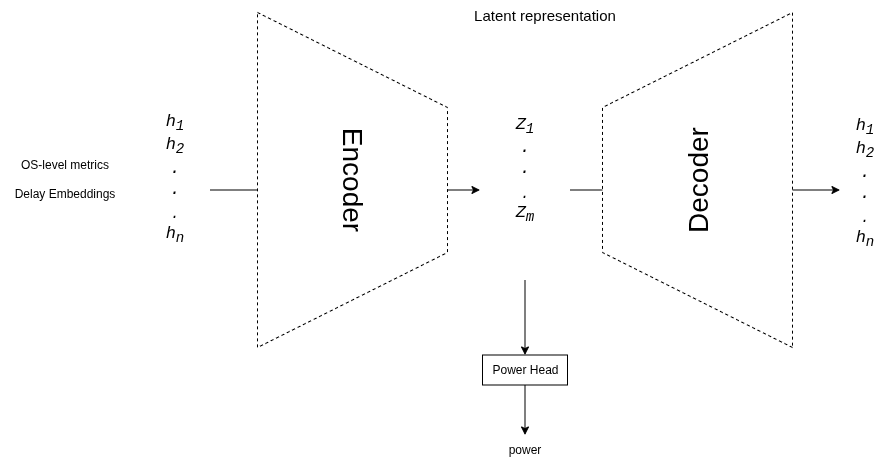
- Removed LSTM — delay embedding has temporal info
- 268K params
- Overfit at epoch 2 without normalization
- Reconstruction loss competes with prediction
v3: Encoder + Power Head
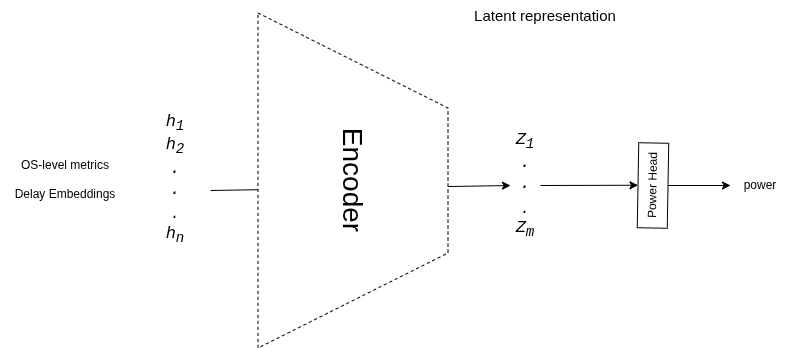
- Removed decoder entirely — pure predictor
- Added MinMaxScaler normalization
- Offline: R² = 0.96, MAE = 2.16W
- Live: Still fails on idle & real workloads
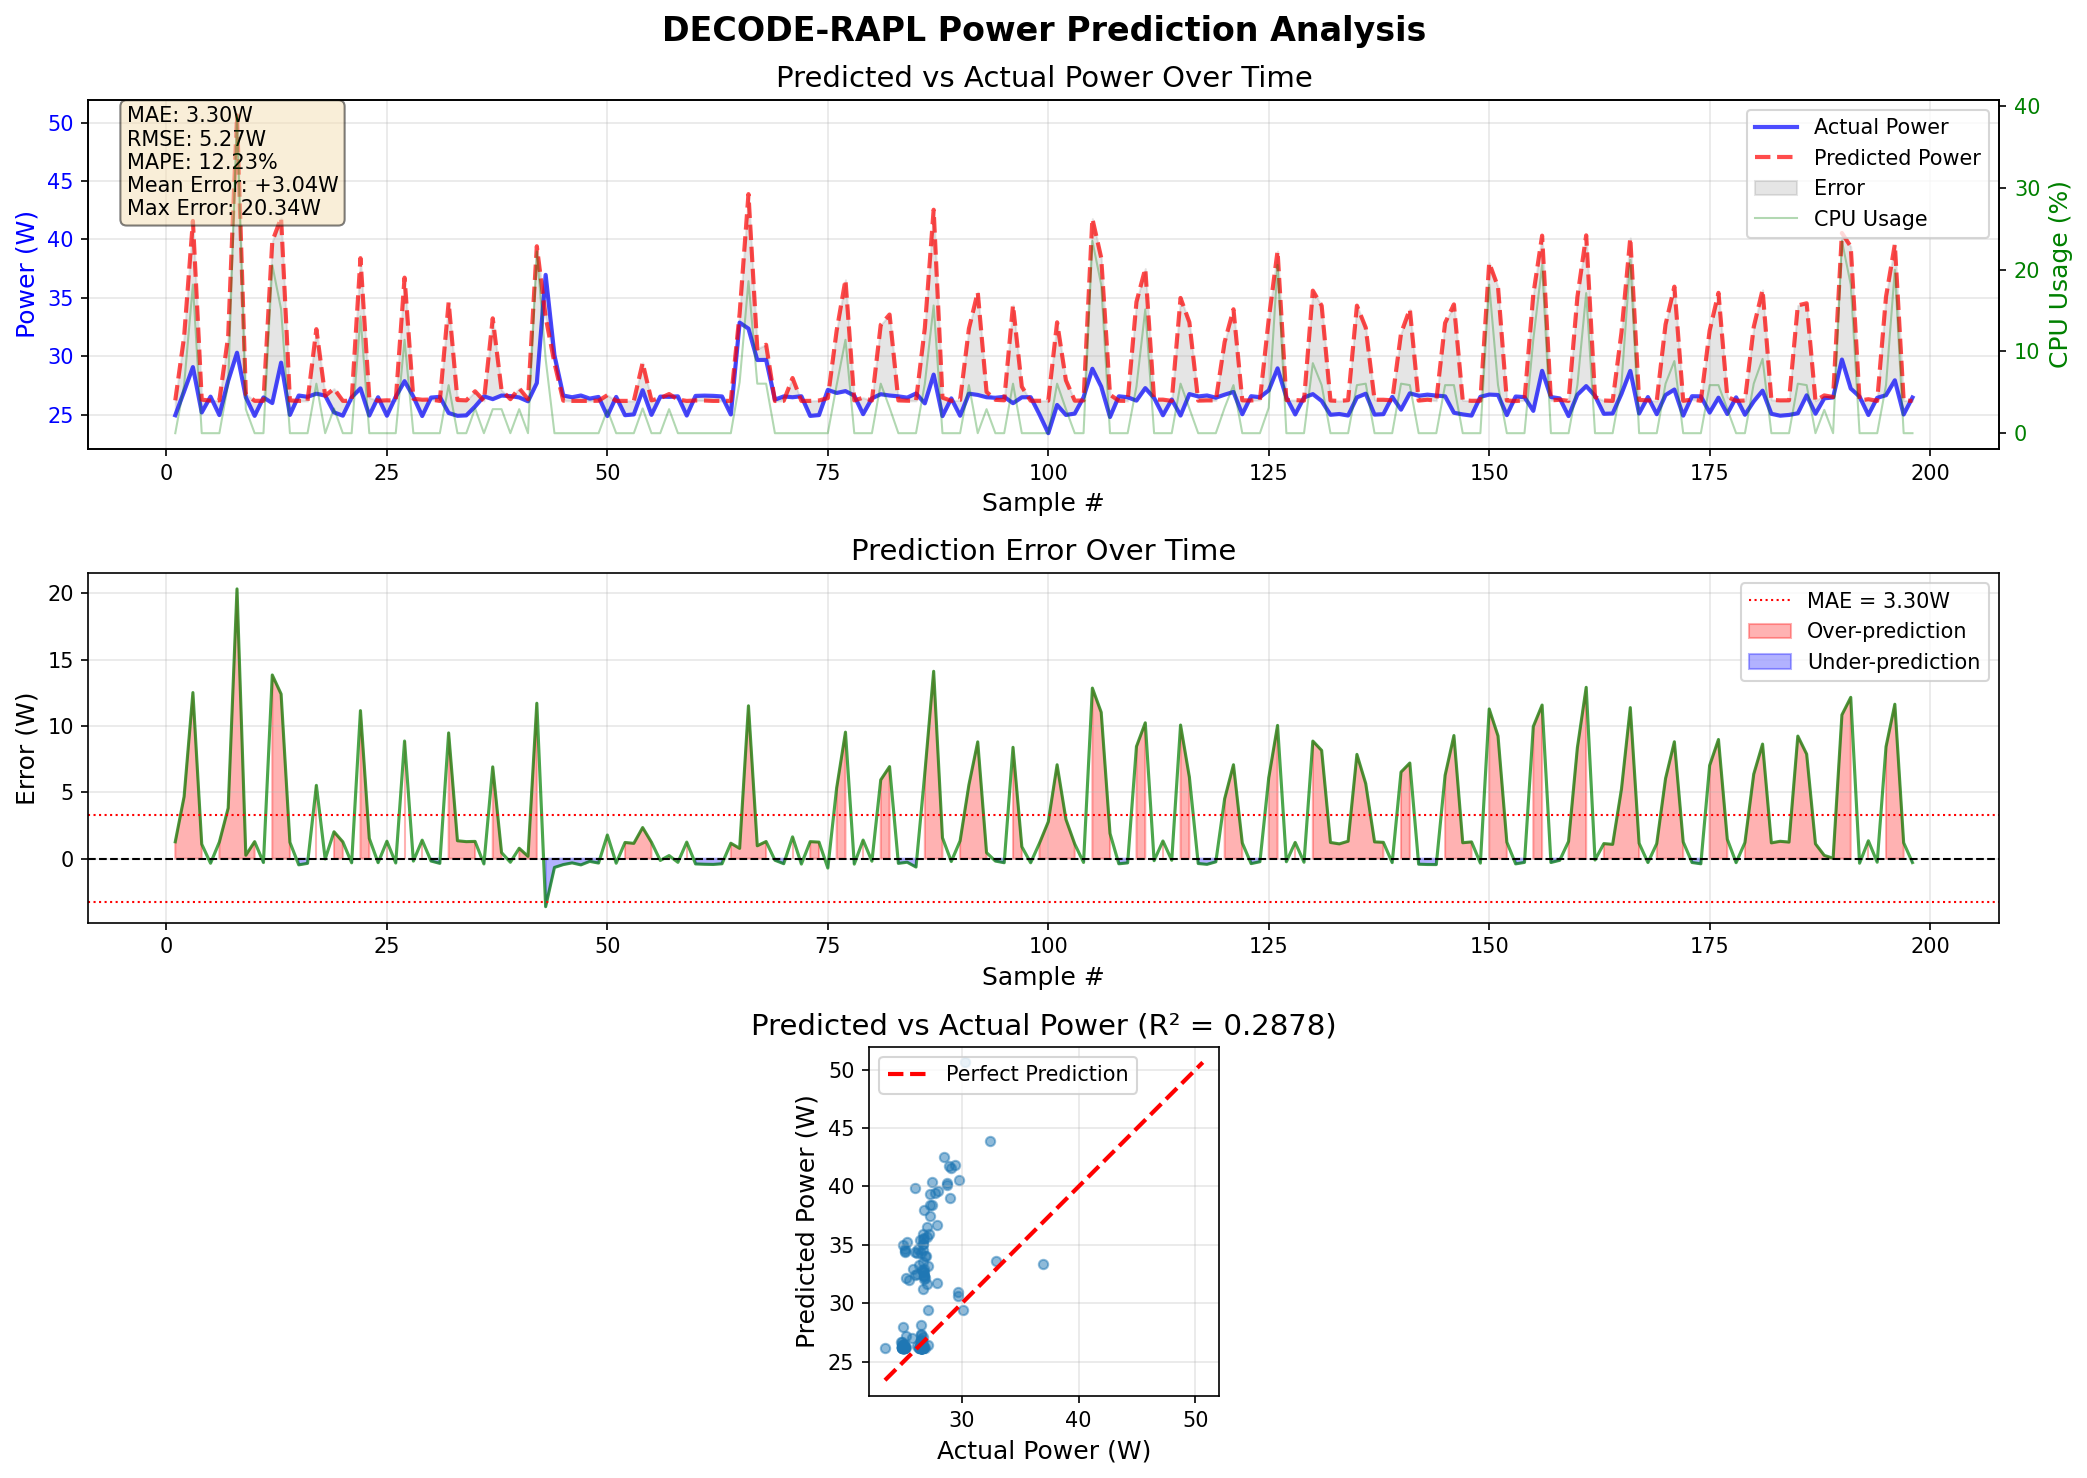
v3: Best Offline, Still Fails Live
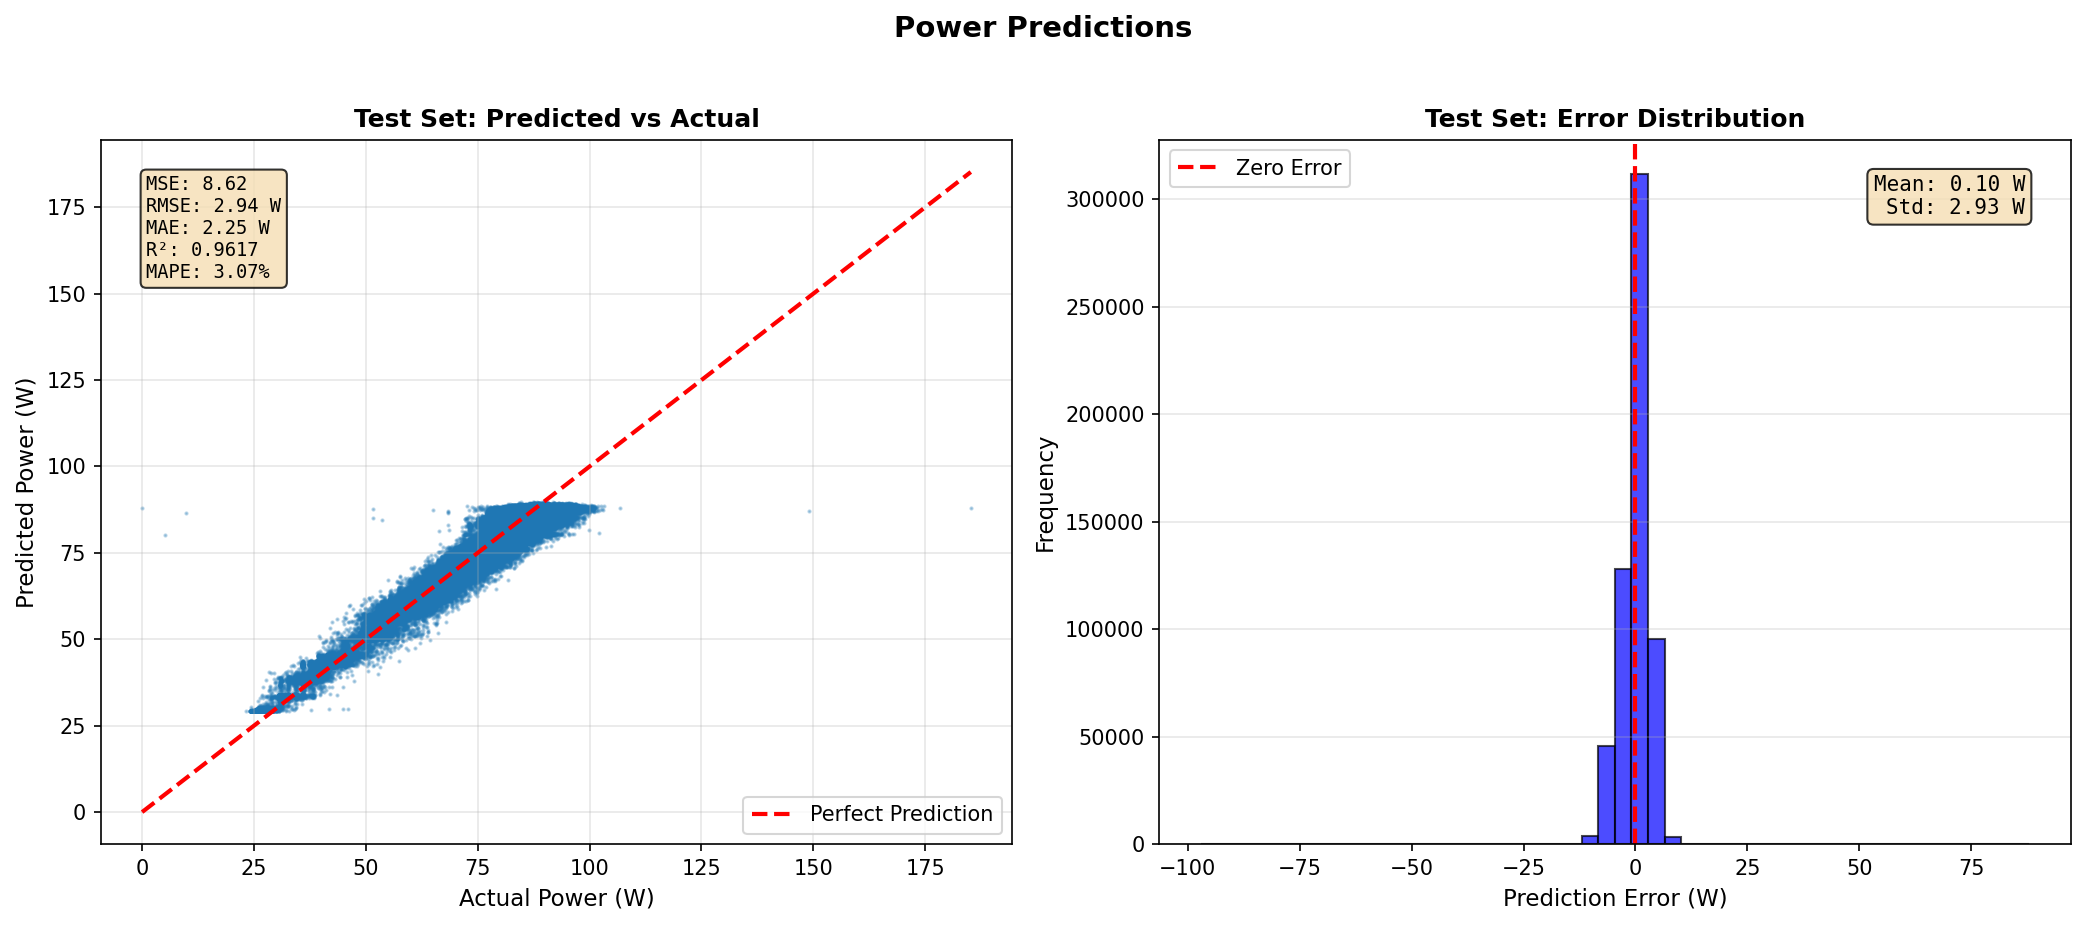
Offline: R² = 0.96, MAE = 2.16W
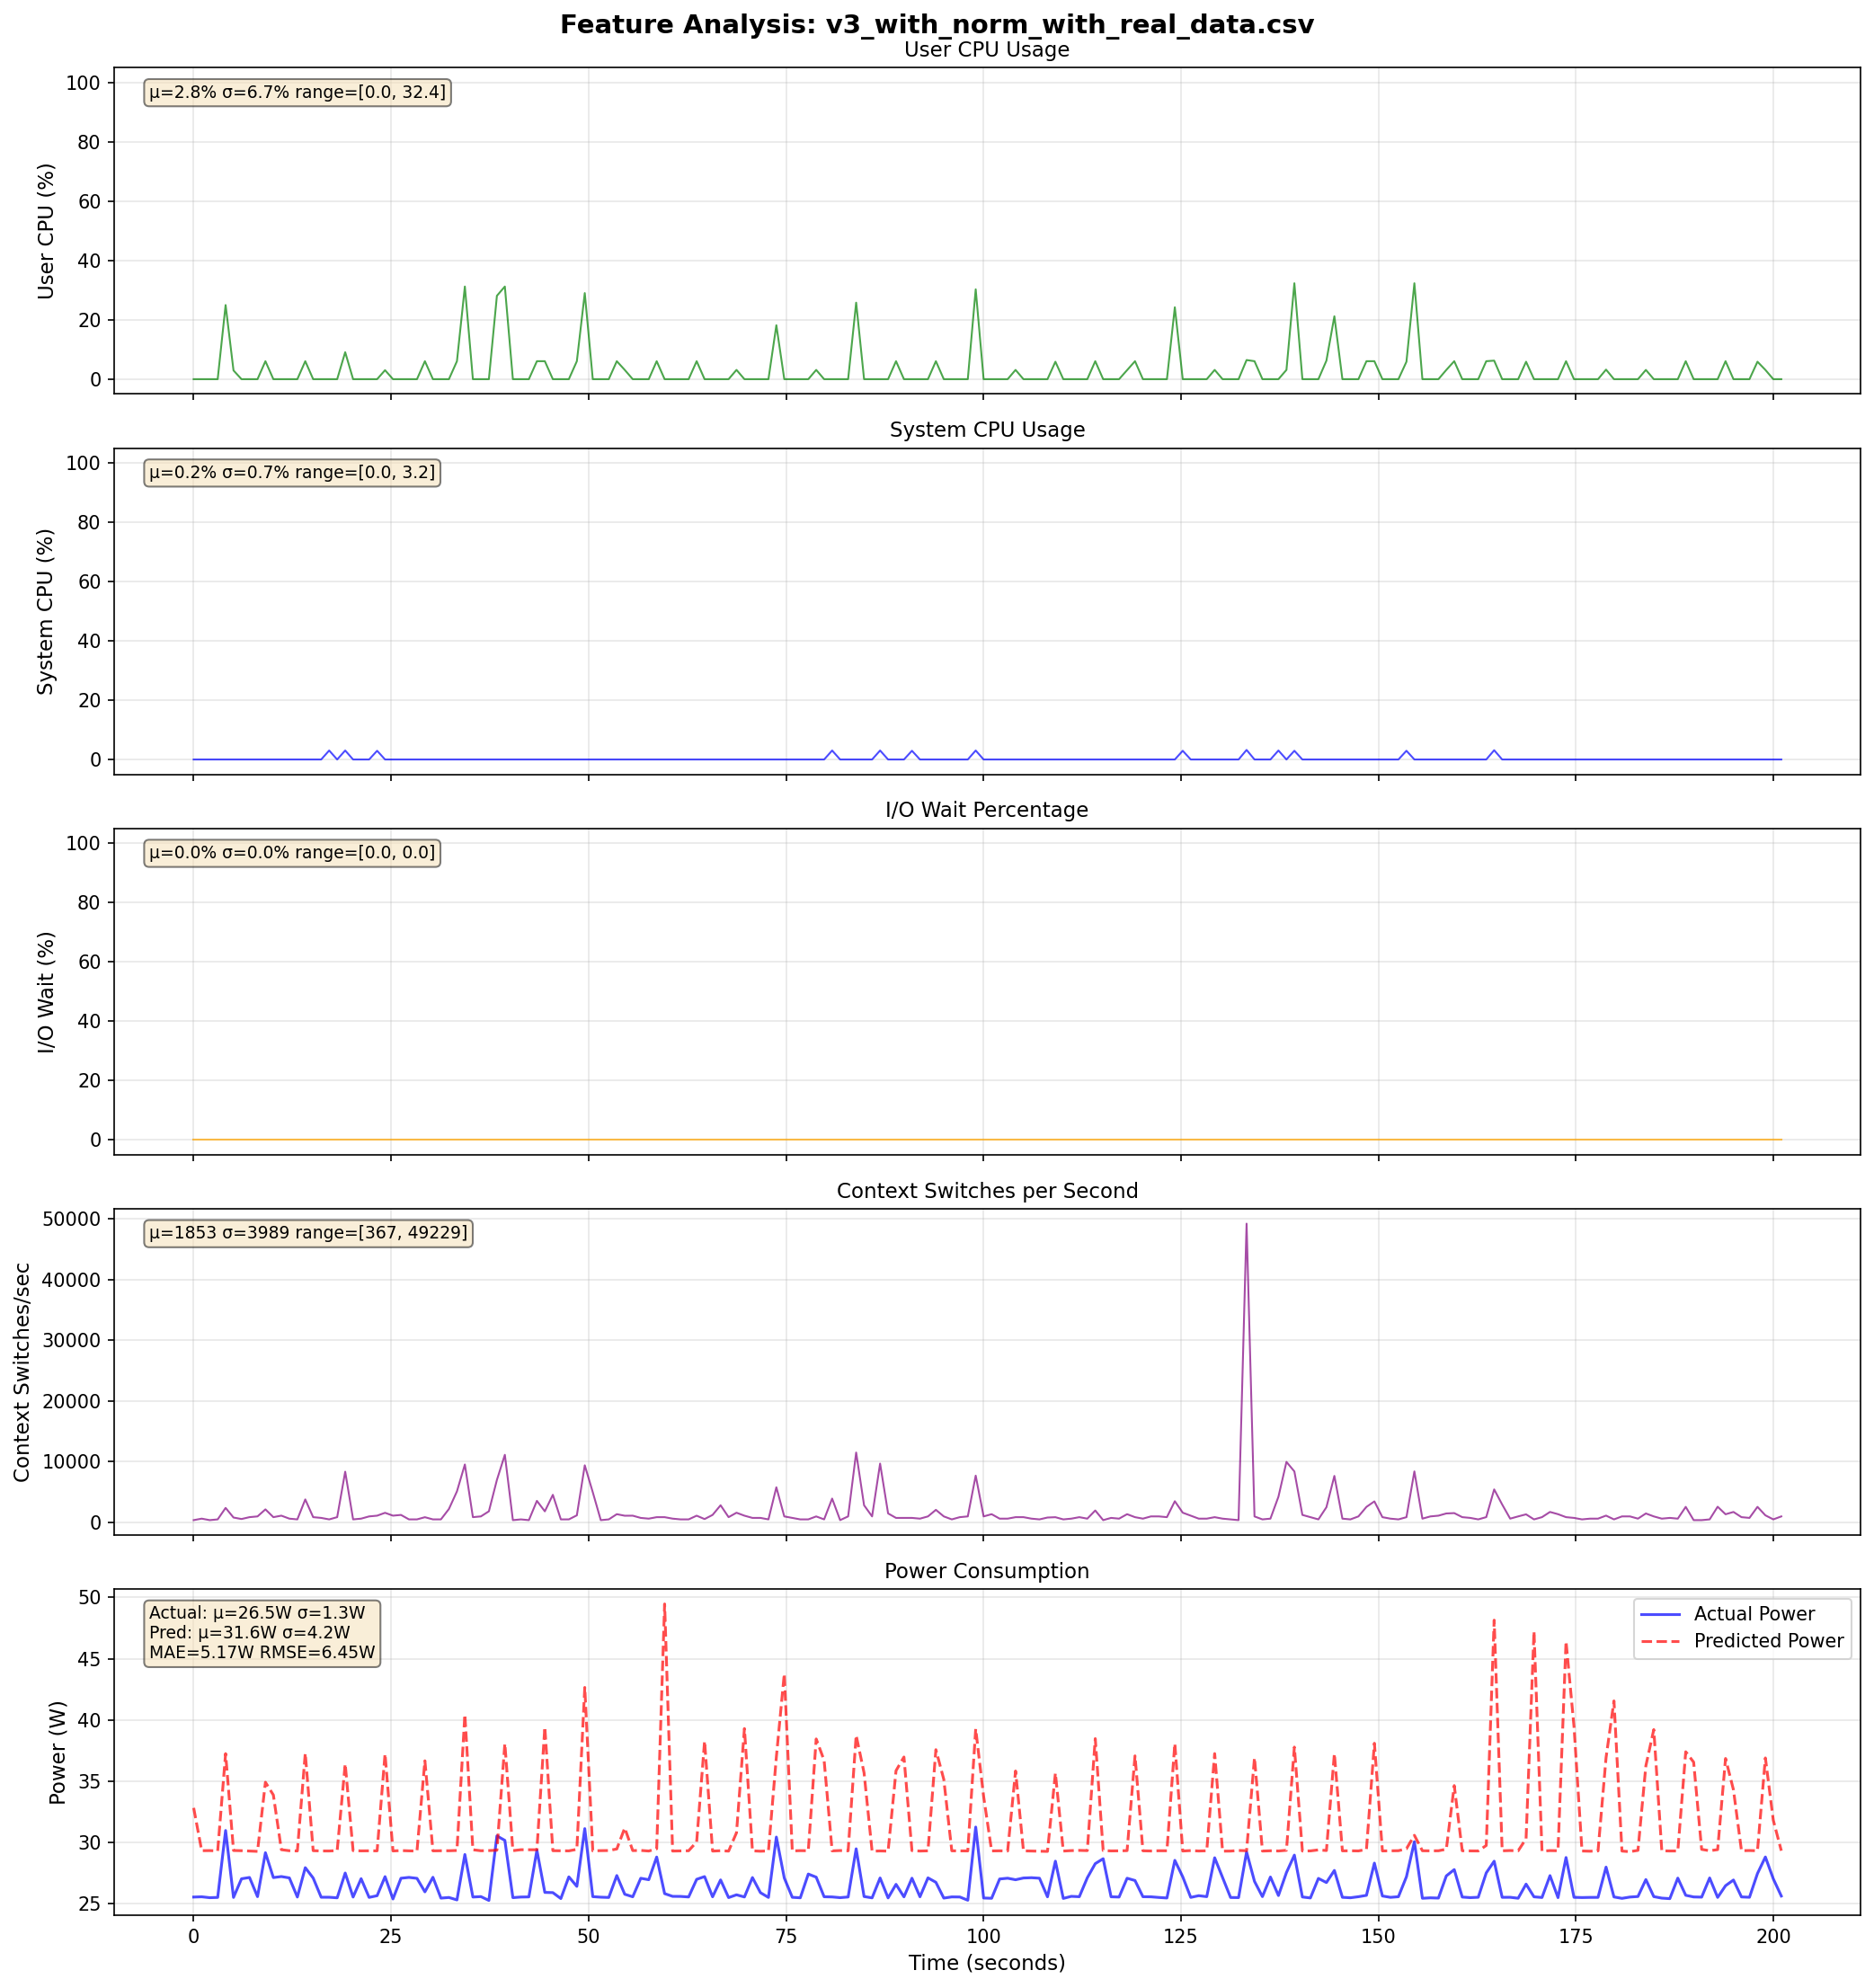
Live: Significant errors on real data
The offline/online gap persists. Near-perfect on shuffled test set, but fails on sequential live data.
v4: 1D-CNN Encoder + Power Head

- Replaced MLP with 1D Conv layers
- Input:
(batch, 4, 25)— per-feature temporal processing - Kernels (5 steps ≈ 80ms) learn temporal motifs
- Switched to MAE loss (L1)
- Tested across τ = 1, 4, 8
- Offline: R² ≈ 0.95
v4: Live Predictions Across τ Values
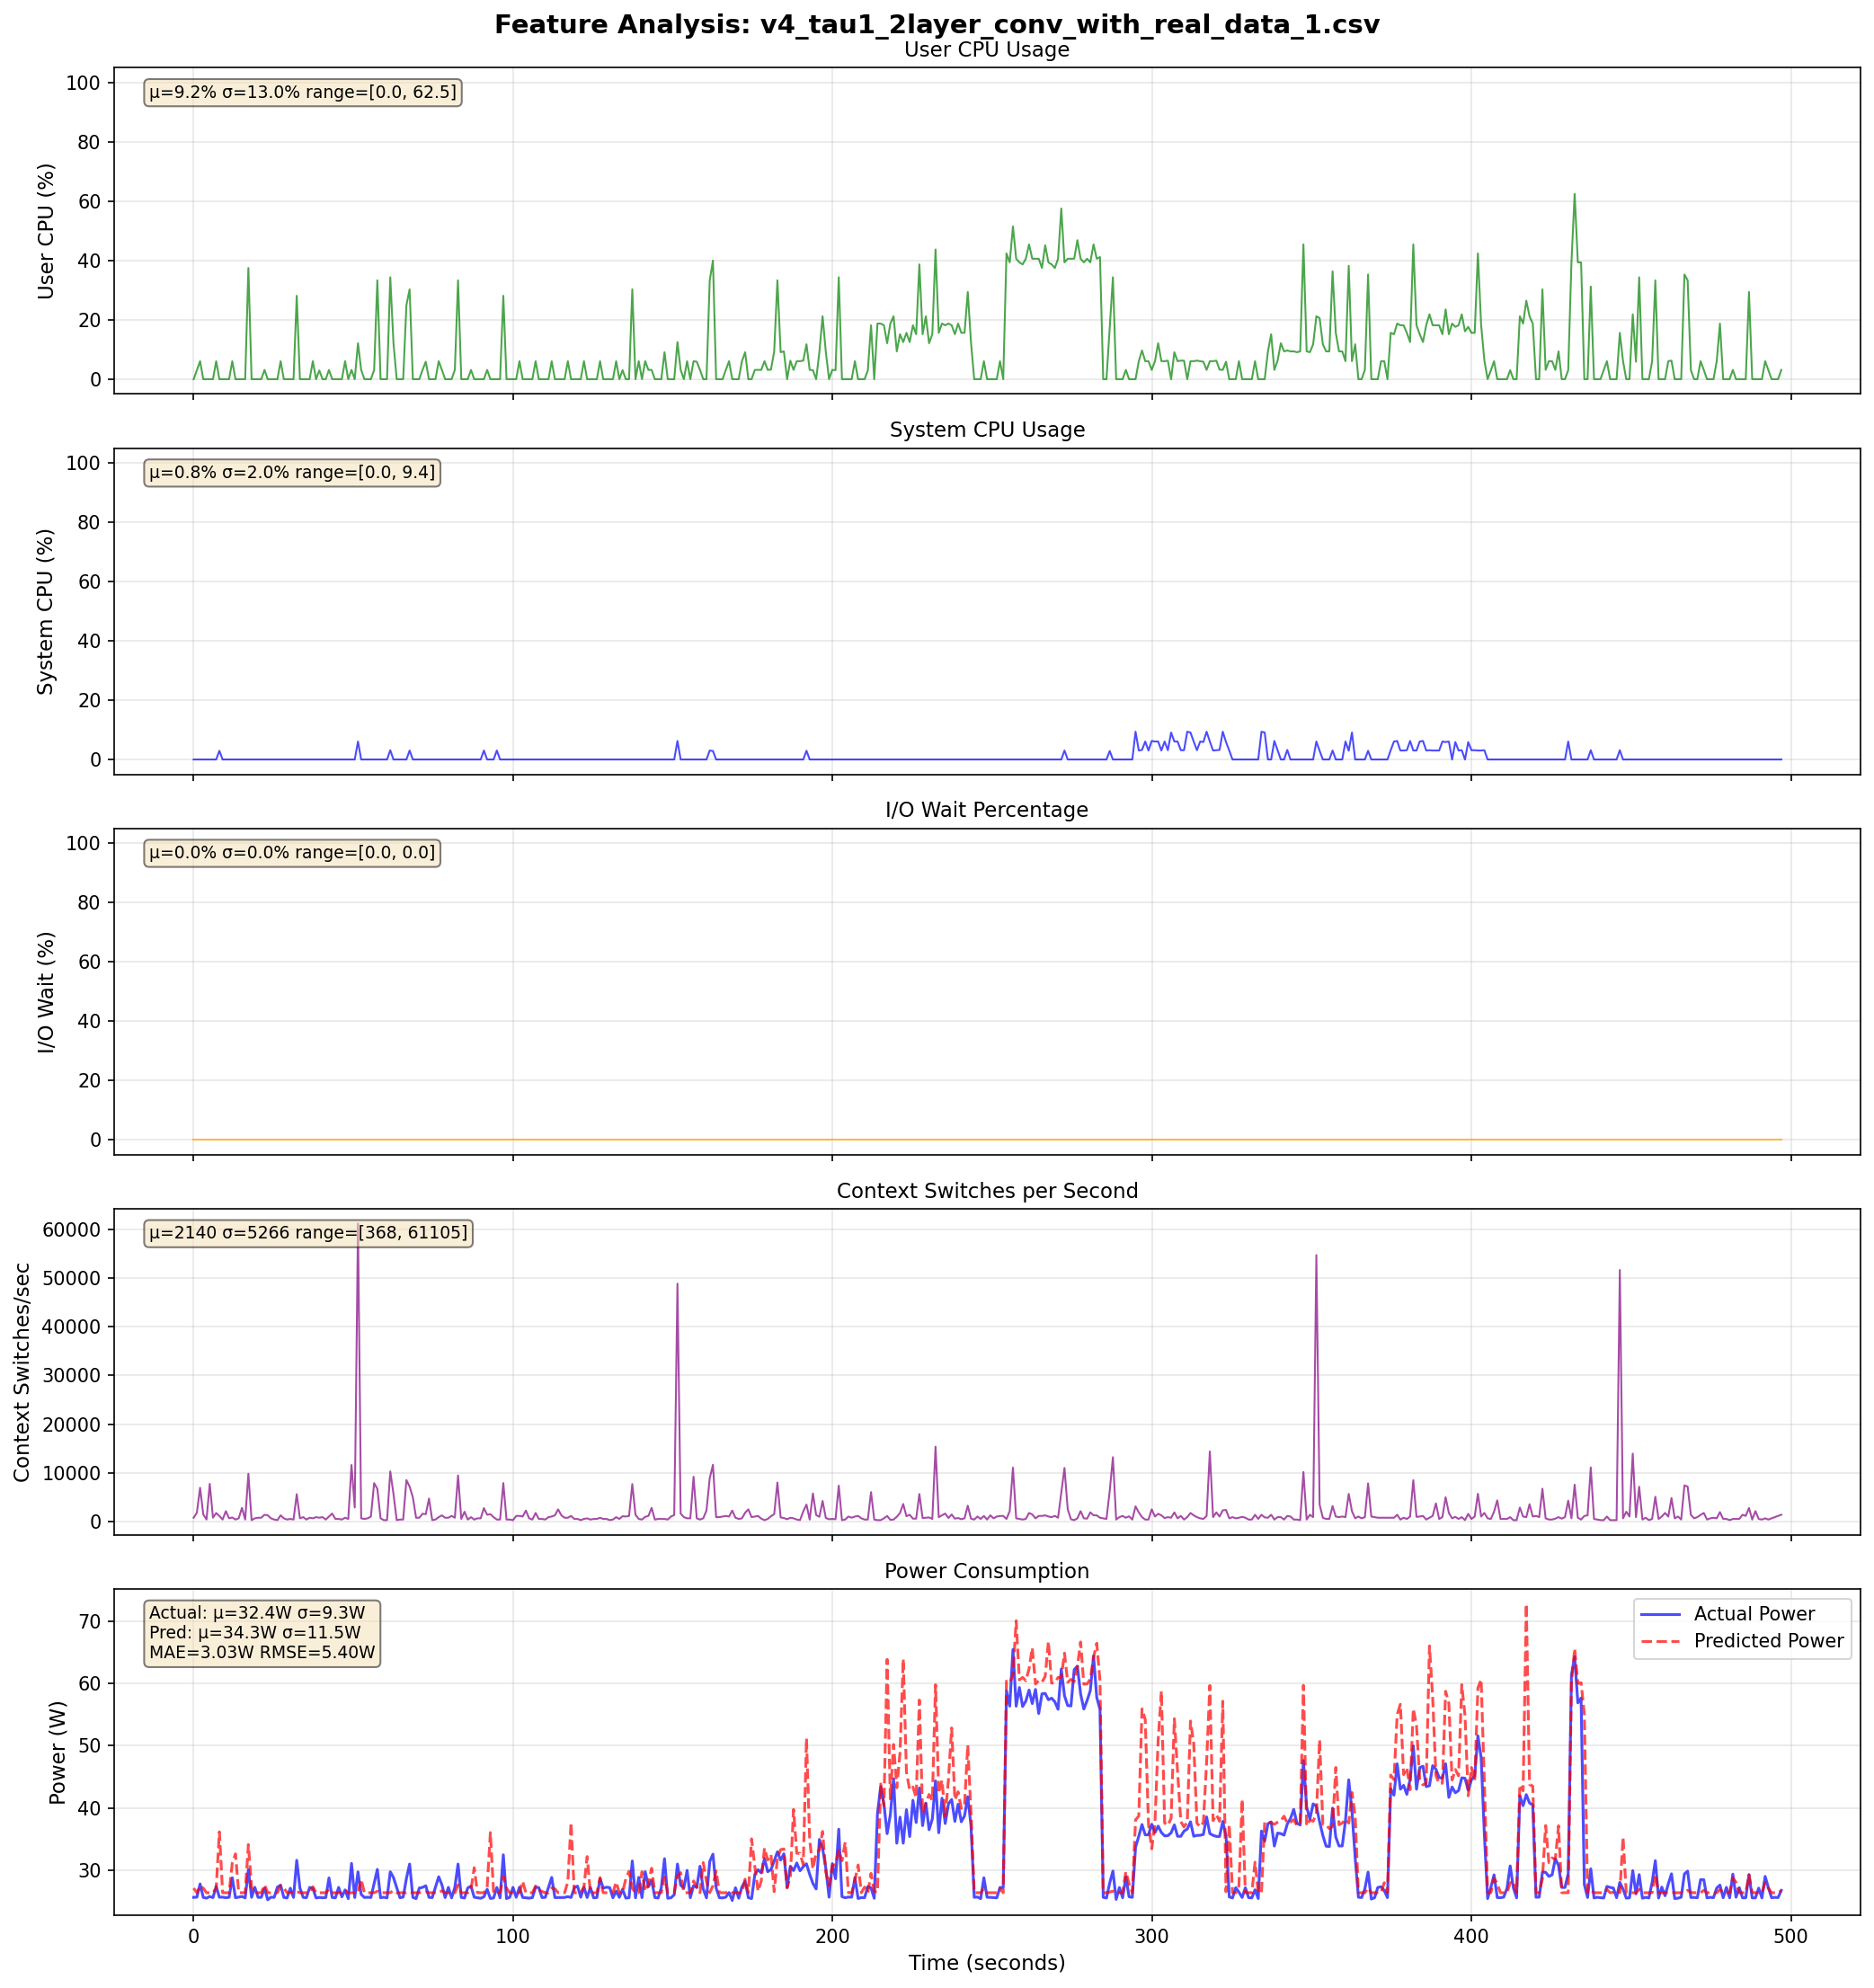
τ = 1
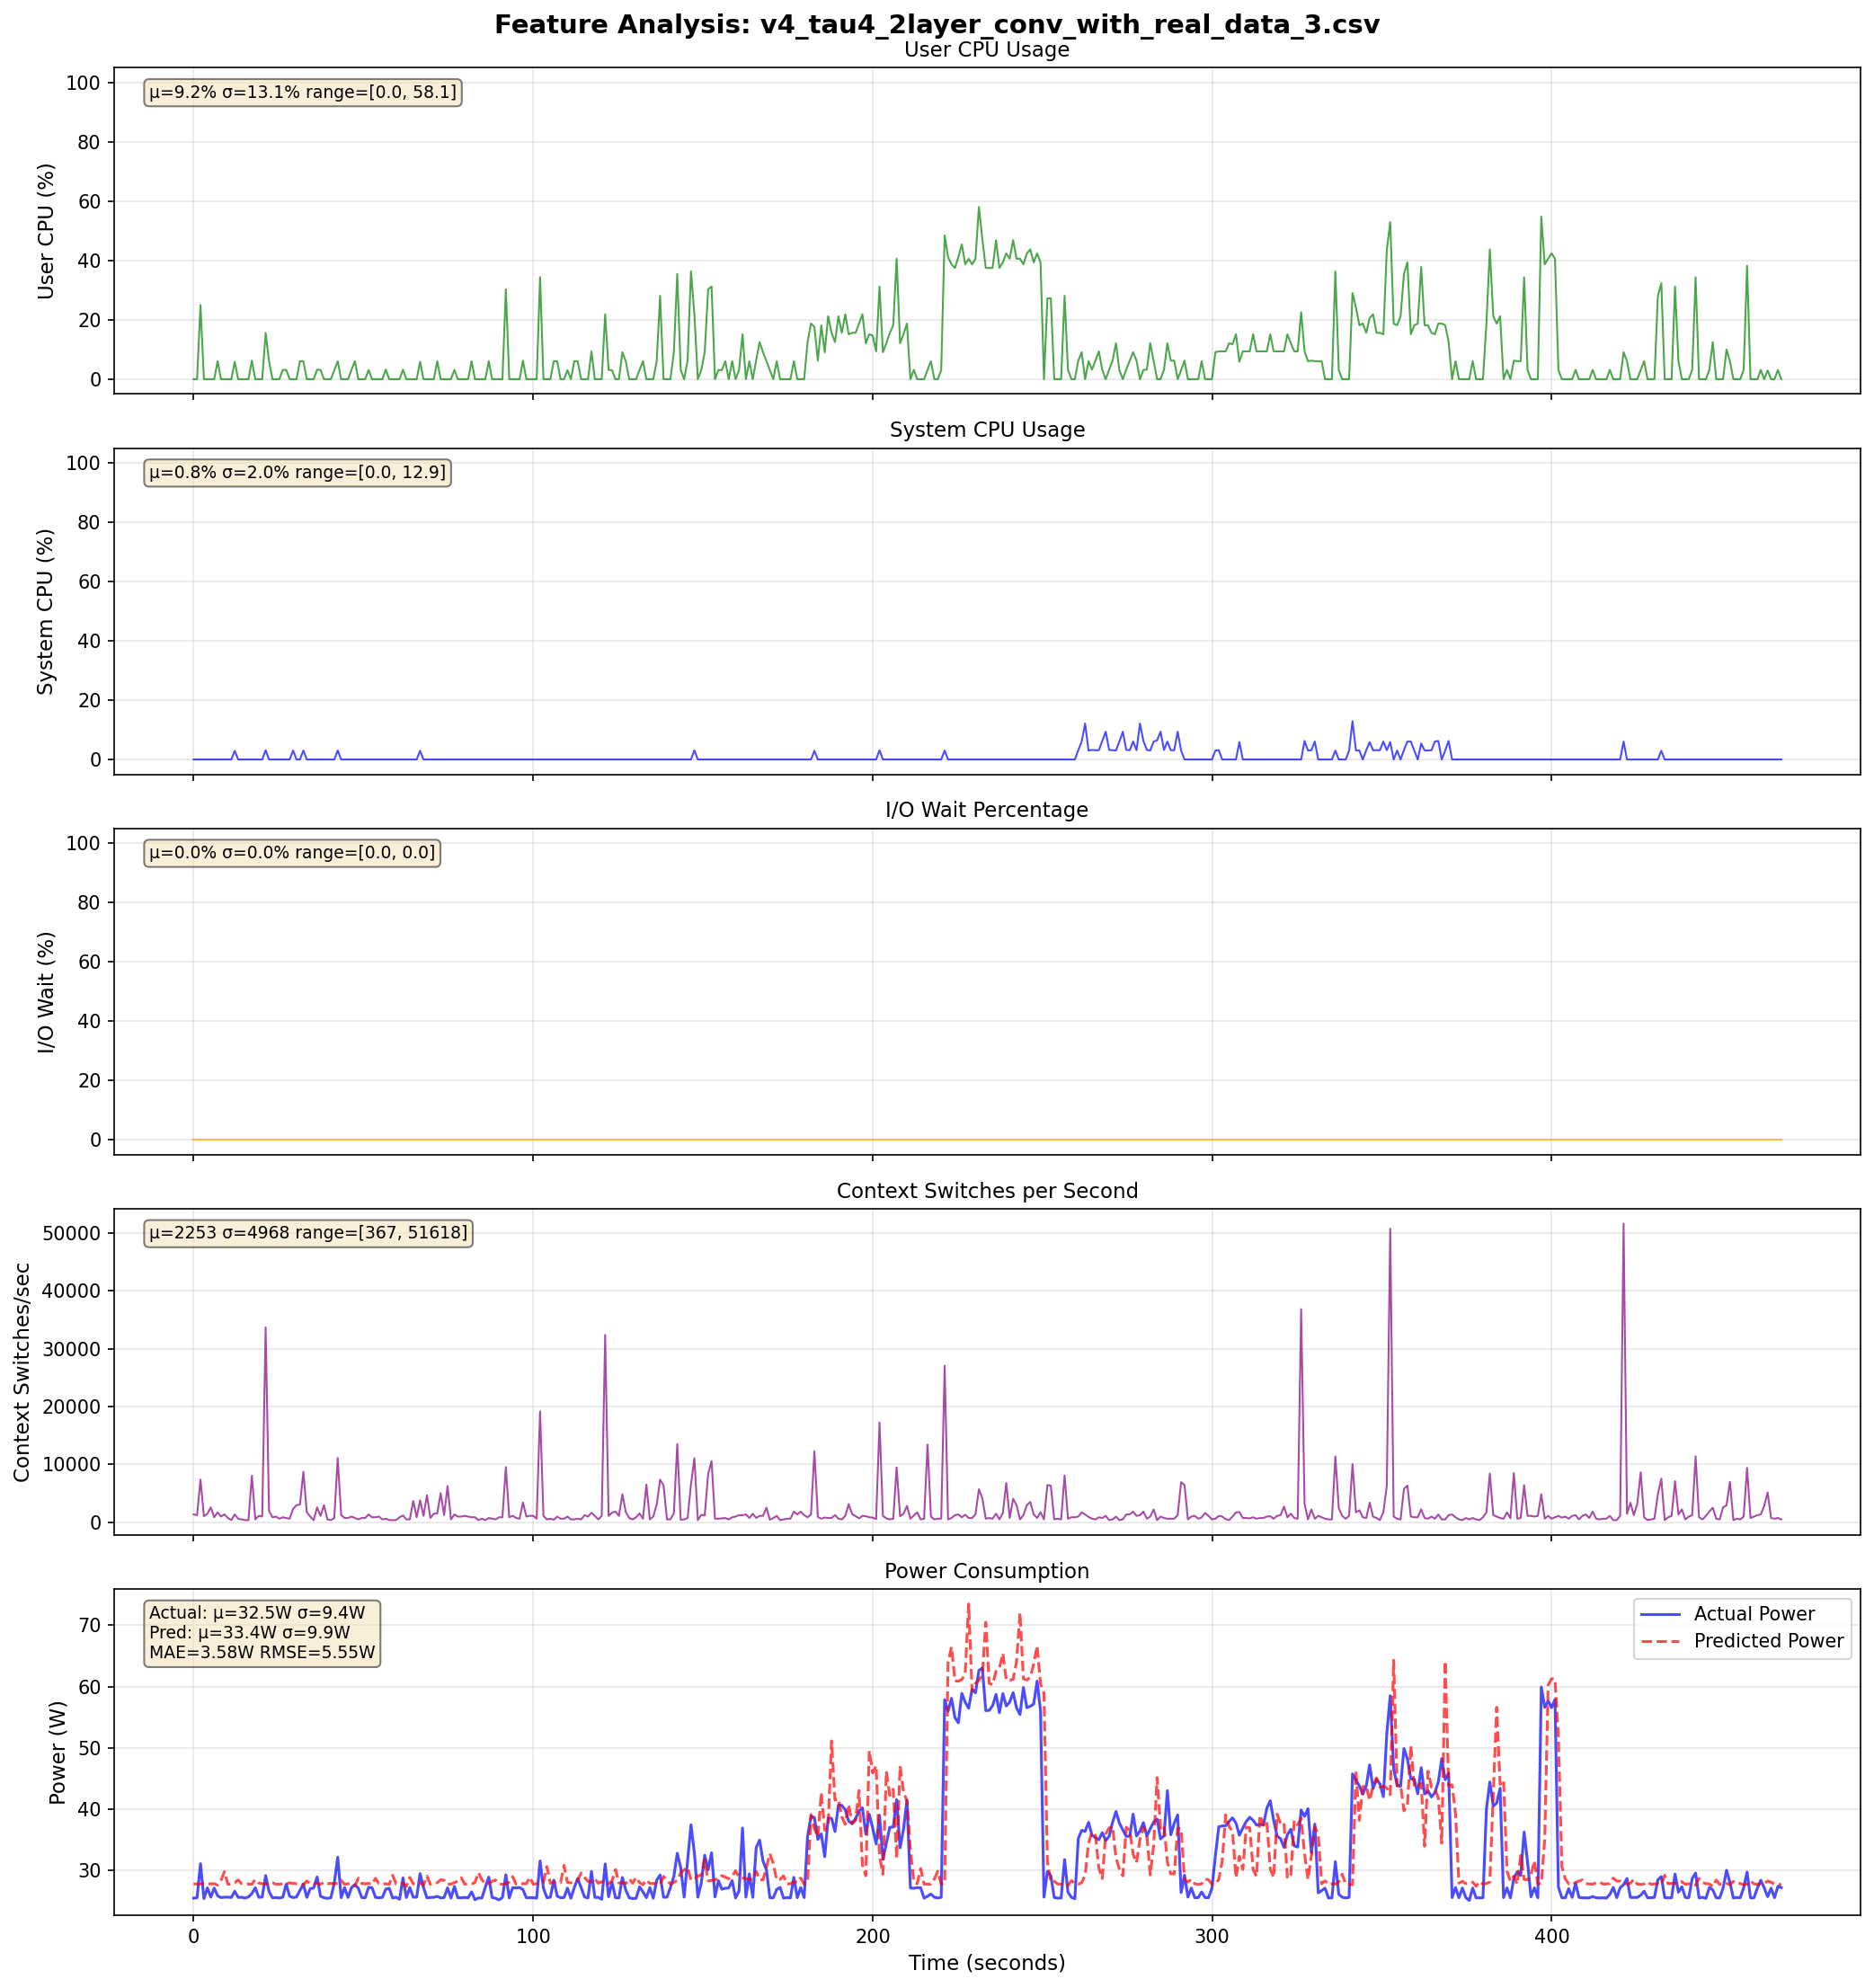
τ = 4
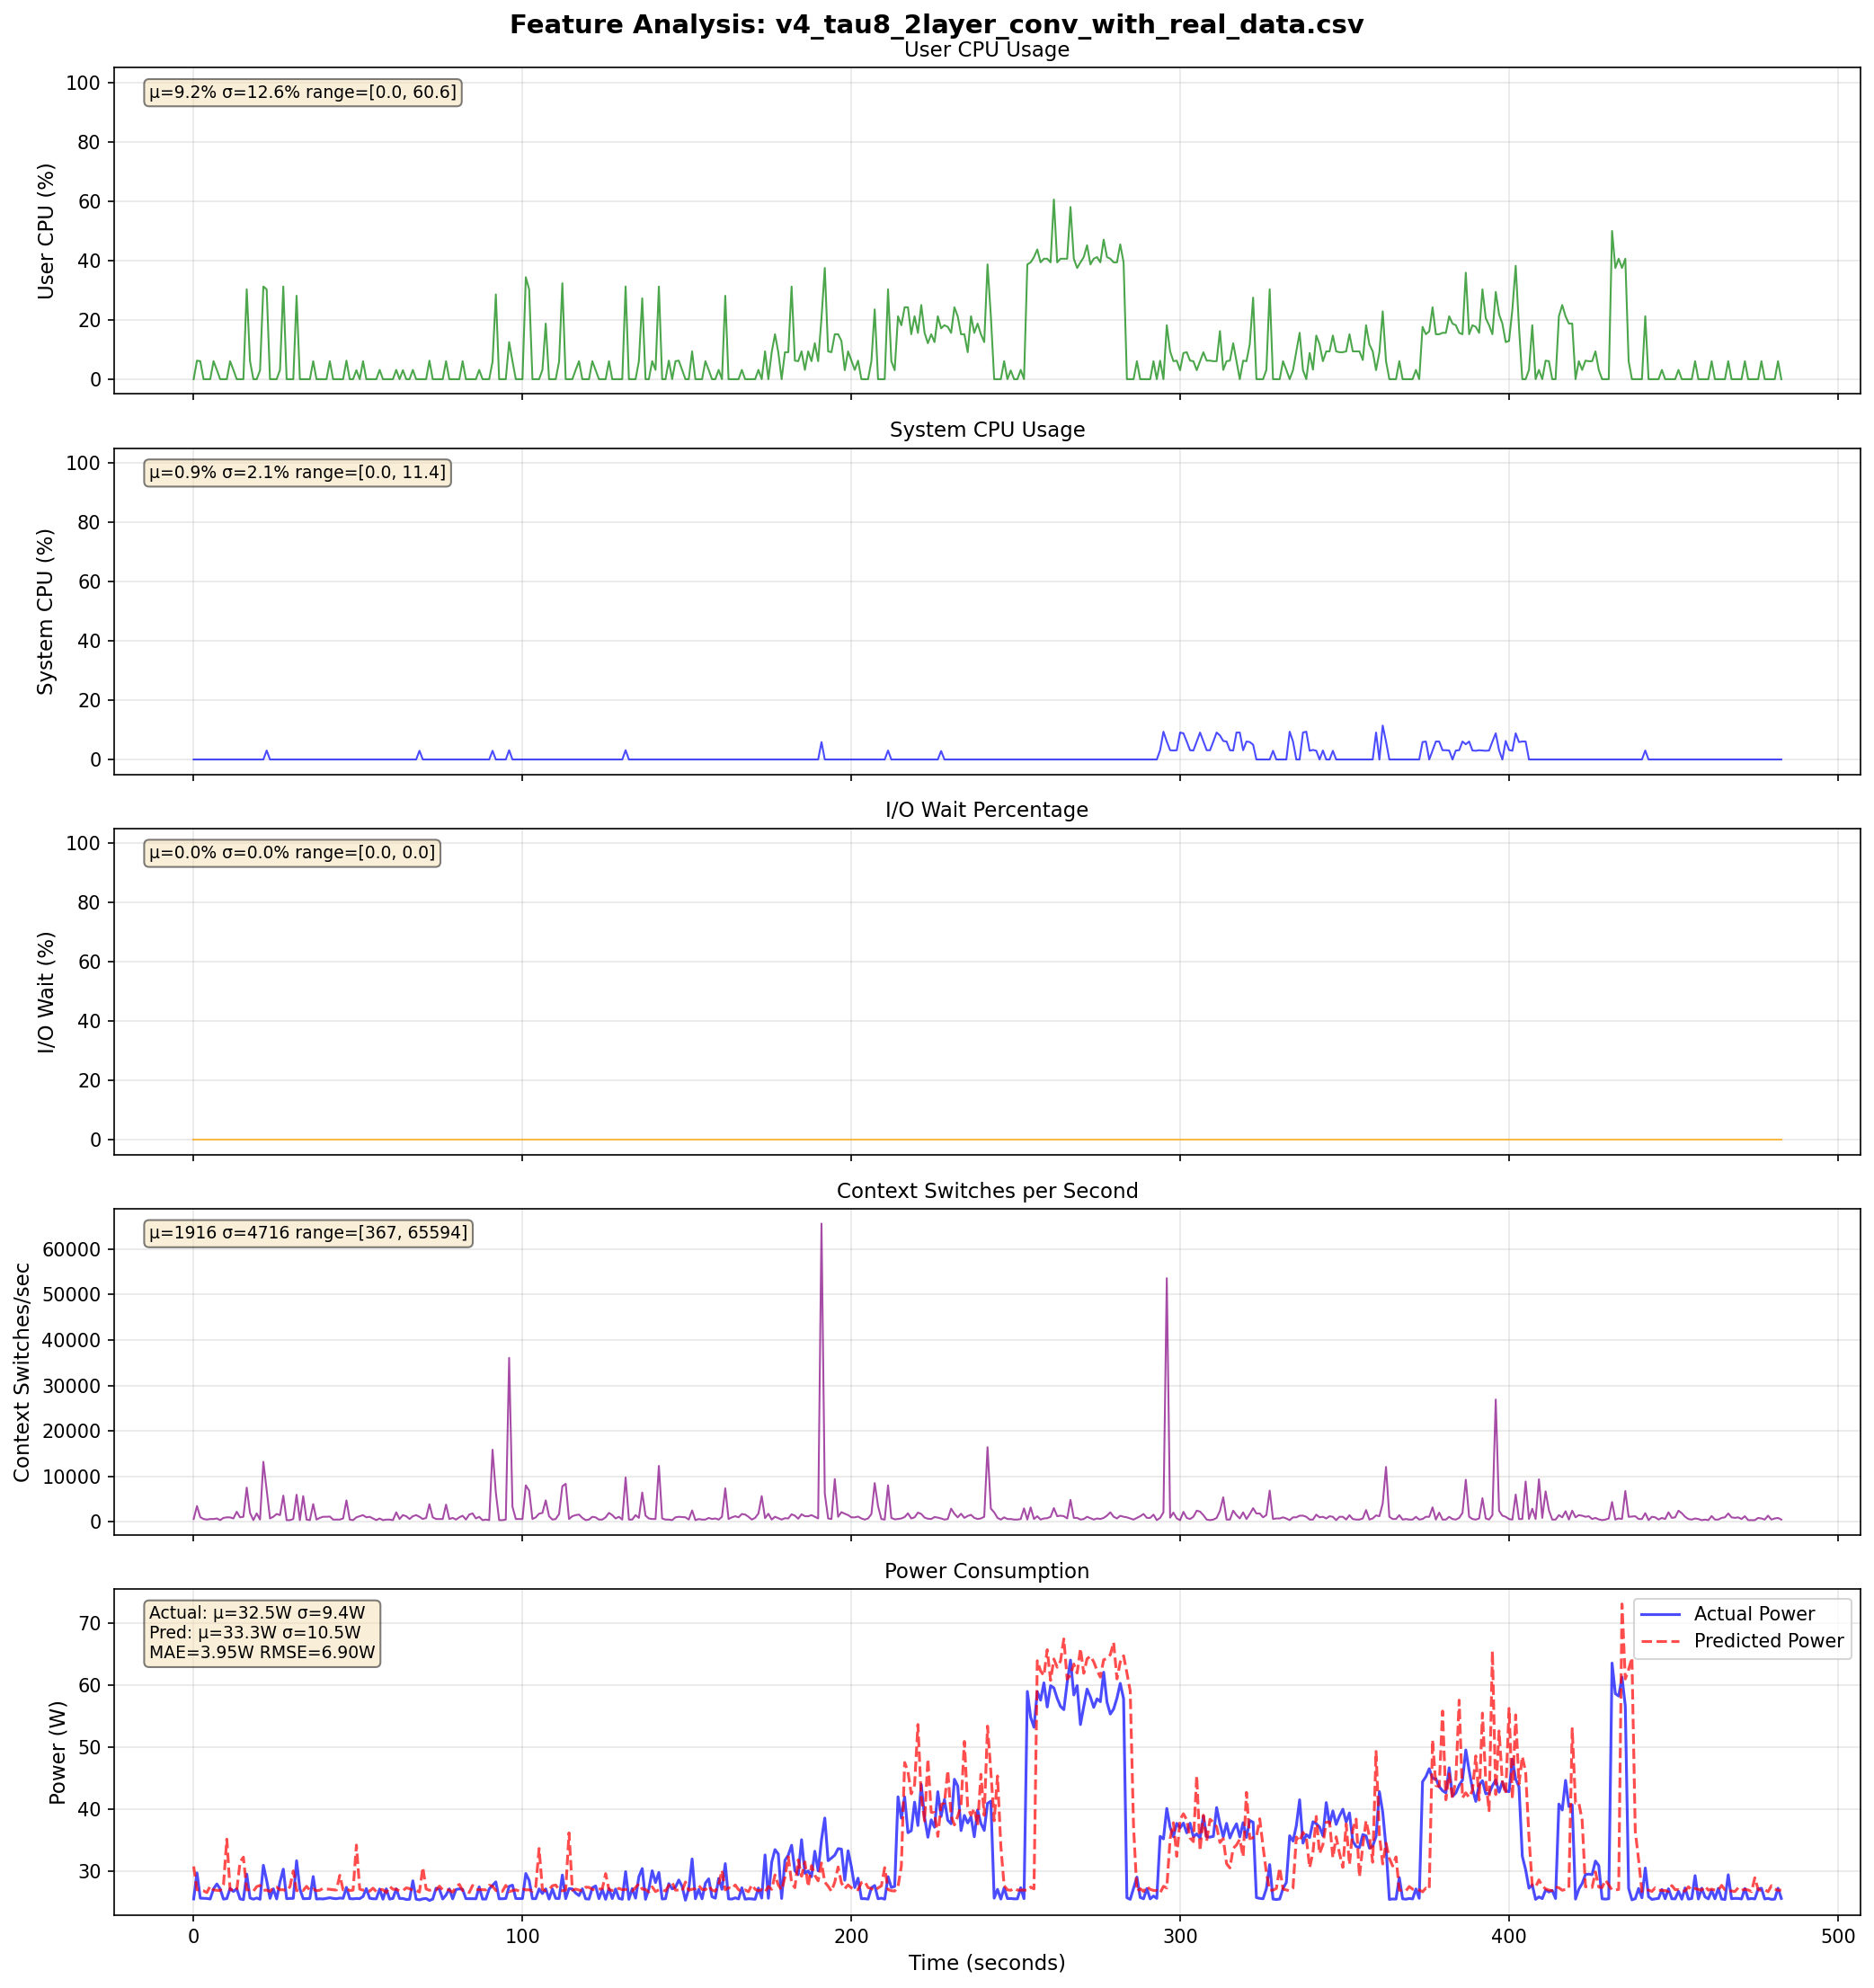
τ = 8
- Idle baseline improved by ~3W (MAE loss helped)
- Spike overreaction persists across all τ values
Summary: The Consistent Pattern
| Approach | Architecture | Offline R² | Live Performance | Key Change |
|---|---|---|---|---|
| MS-TCN | Multi-scale CNN + Attention | 0.96 | Failed on real workloads | 19 raw features |
| v1 | AE + LSTM + Power Head | 0.97 | R² = 0.29–0.40 | Delay embedding, 4 features |
| v2 | AE + Power Head | — | Overfitting | Removed LSTM |
| v3 | Encoder + Power Head | 0.96 | Failed on live | Removed decoder, added norm |
| v4 | 1D-CNN + Power Head | 0.95 | Slightly better (+3W idle) | Conv layers, MAE loss |
Root Cause: OS-level features fundamentally cannot capture microarchitectural details (instruction mix, cache behavior, pipeline utilization). The features, not the models, are the bottleneck.
Future Directions
- Alternative VM-visible metrics: guest CPU frequency, page fault rates, I/O throughput, eBPF tracing
- Post-processing calibration: per-workload-class correction factors (e.g., subtract +3W idle offset)
- Adversarial/domain-adaptation training: close the offline–online gap with domain-invariant latent representations
- Multi-machine generalization: train across same-architecture machines for architecture-level power models
- Hybrid approach: physics-informed constraints on power bounds + learned representations
The model works. The features don't.
The deep learning pipeline is validated. Progress requires richer input signals that expose more of the CPU's hidden microarchitectural state.
The deep learning pipeline is validated. Progress requires richer input signals that expose more of the CPU's hidden microarchitectural state.